 |
ちょっと gnuplot のお勉強.完全に自分用メモですがなんかの役に立つこともあるかもしれません.
こういうのちょっとまとめて置いとくと自分で参照するのに結構便利なのです.
ある程度蓄積したら google site にまとめ直したいなとか.
gnuplot といえば,
$ gnuplot > plot sin(x)今日はとりあえず函数グラフじゃなくて,データファイルからプロットする時の色々を.
画像たっぷりで重く長くなるので以下 read more.
http://www.gnuplot.info/docs_4.0/gpcard.pdf とかも良さそうですね.
データファイルとしては,今回はこの二次元データを使用します(リンク先: google drive).
ちょっとした実験のデータ(公開するのに全く問題ない).
とりあえずは芸もなく
gnuplot> plot "./data1.dat" をファイルのあるディレクトリで実行すれば plot してくれます.
なお, gnuplot ではたとえば
with を w のように略記できるのですが,そのへんは適当に.
0. ヘルプの見方
gnuplot って割に怖いイメージがあったんですが,案外そうでもない.
とりあえず
> help 
ちなみに最初に表示される「いろいろ」もかなり長いししっかりしてる.
結構 help コマンドは賢くできてて,「これしたいな」っていうのを引数にすると
詳しく説明してくれることが多い.たとえば
> help plot 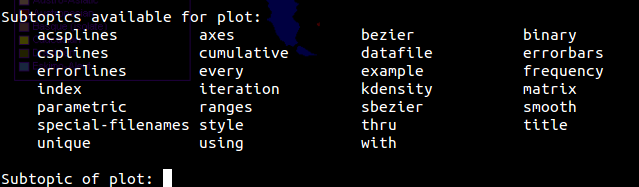
てなわけで,ググるとともに help コマンドに色々聞きながらやっていきましょう.
1. 出力先の変更
 最初に起動したときはプロットの出力先は環境にあったウィンドウという設定で,普通にプロットしてもらうとまずは新しいウィンドウが開いてそこに表示されることになる.
僕の環境では,最初に
terminal type set to 'wxt'と言われ,そのまま plot すると右みたいな感じになる.x11がもうちょっと普通のウィンドウになる模様.
そこから clipboard にコピーして,みたいなこともできるわけだが,ここは直接画像で保存したいところ.
という訳で出力先を変更します.
set terminal fooと set output bar.ext みたいな標識を使って設定します(後者が出力ファイル名の指定).ヘルプいわく,
gnuplot> help set terminal set terminal {<terminal-type> | push | pop}
show terminal
If
`set terminal` and `set output` are used together, it is safest to
give `set terminal` first, because some terminals set a flag which is needed
in some operating systems.
というわけで
set terminalを実行して一覧を見せてもらってみた,ものの結構数が多い.いくつかピックアップすると
- dumb ascii art for anything that prints text
- gif GIF images using libgd and TrueType font
- jpeg JPEG images using libgd and TrueType fonts
- latex LaTeX picture environment
- png PNG images using libgd and TrueType fonts
- postscript PostScript graphics, including EPSF embedded files (*.eps)
- svg W3C Scalable Vector Graphics driver
- tikz TeX TikZ graphics macros via the lua script driver
dumbの出力結果はこちら. |
| set terminal dumb plot sin(x) |
inkscape で加工するなら svg とかが多い気がしますが,今回は png を使います.
gnuplot> help set terminal png
 Syntax:
       set terminal png
              {{no}transparent} {{no}interlace}
              {{no}truecolor} {rounded|butt}
              {linewidth <lw>} {dashlength <dl>}
              {tiny | small | medium | large | giant}
              {font "<face> {,<pointsize>}"} {{no}enhanced}
              {size <x>,<y>} {{no}crop}
              {<background_color>}
gnuplot> set terminal png
Terminal type set to 'png'
Options are 'nocrop font /usr/share/fonts/truetype/ttf-liberation/LiberationSans-Regular.ttf 12 size 640,480 '
gnuplot> set output "data1.png"
gnuplot> plot "./data1.dat"
結果は

set outputを忘れるとそのまま端末に出力されて 
えらいことになるので注意.
さて,こういう plot のスタイルを変更するのによく使うっぽいのが with (ないし w) * .
help で見ると
gnuplot> help with
Functions and data may be displayed in one of a large number of styles.
The `with` keyword provides the means of selection.
Syntax:
       with <style> { {linestyle | ls <line_style>}
                      | {{linetype  | lt <line_type>}
                         {linewidth | lw <line_width>}
                         {linecolor | lc <colorspec>}
                         {pointtype | pt <point_type>}
                         {pointsize | ps <point_size>}
                         {fill | fs <fillstyle>}
                         {nohidden3d} {nocontours} {nosurface}
                         {palette}}
                    }
where <style> is one of
lines dots steps errorbars xerrorbar xyerrorlines
points impulses fsteps errorlines xerrorlines yerrorbars
linespoints labels histeps financebars xyerrorbars yerrorlines
vectors
or
boxes candlesticks image circles
boxerrorbars filledcurves rgbimage
boxxyerrorbars histograms rgbalpha pm3d
The first group of styles have associated line, point, and text properties.
The second group of styles also have fill properties. See `fillstyle`. Some
styles have further sub-styles. See `plotting styles` for details of each.
ついでに
Syntax:
       set style fill {empty
                       | {transparent} solid {<density>}
                       | {transparent} pattern {<n>}}

                      {border {lt} {lc <colorspec>} | noborder}
The default fillstyle is `empty`.
複数のを plot すると色々かぶらないように自動で設定してくれるようですが,
自分で色々いじってみましょう.
pointtype については http://www.tantal.dk/?p=linux/gnuplot にいい感じの図があります.
たとえば
 |
| plot "./data1.dat" w linespoints ls 4 |
 | |
| plot "./data1.dat" w steps |
 |
| plot "./data1.dat" with boxes lt 7 fs pattern 9 border lc rgbcolor "#34aa33" |
lt ; linetype, fs; fill style, lc ; line color. 色はああやって指定するみたい.
とりあえず今日はこのへんで.
No comments:
Post a Comment